ŞİŞECAM Valuation 2023/q1
Thread in Turkish
Türkiye Şişe ve Cam Fabrikaları A.Ş. was founded in 1936 by İş Bank and currently consists of a holding company with 57 subsidiaries, 1 joint venture 2 associates and 1 joint activity.
Şişecam is among the world’s most prestigious manufacturers and with its 87 years of corporate history, it has a considerable experience and high degree of specialisation. As a global company Şişecam has production activities spanning 14 countries on four continents, and sales in more than 150 countries. Following the merger, which was completed as of 01 October 2020, Şişecam aims to become one of the top three global producers in all its core business lines. As it is already in top five, and investments keep rolling on, in my opinion this aim is within reach.
Following this brief introduction, let me cover the financials of the company for 2023/q1.
1 – Segments and Regions
The very first change that took my attention in the recent financial report was the new segment reporting. As I indicated in Figure 1, Şişecam had previously 6 segments, namely: architectural glass, automotive glass, glassware, glass packaging, chemicals and others. In this quarter we see a name change from “Automotive Glass” to “Industrial Glass” plus a new segment, “Energy” that comes out from the “Other”. Besides there are slight changes in calculations due to shifts, and those will be better grasped in the following periods.

In Figure 2, you see net sales by these segments. On the left side, pie chart shows us the percentage shares, and bars at the right side depict the values of those contributions. At the end of first quarter, revenues of Şişecam stood at 28.365 million Turkish lira (TRY) and “Chemicals” is the top line item with its 27% share in revenue and 7.638 million TRY value. “Architectural Glass” follows that with 20% and “Glass Packaging” is at third place with its 16% share.

When it comes to net sales by region, Figure 3 shows the geographical segments with respect to the customers location. Turkey has the biggest share by 42% and 11.878 million TRY. Europe stands at the second place with 25% and its contribution is 7.192 million TRY.

For those who would like to compare recent quarter data with the adjusted sums of last year’s same quarter, I have also added an executive summary table as Figure 4. Europe’s share increased 70% compared to previous quarter (2022/q4) and 38% compared to last years first quarter (2022/Q1).

Also it must be noted that although produced in Turkey, there are exports from Turkey. Based on sales in and exports from Turkey, the share of international sales for Şişecam reached to 62% at the end of 2023/Q1. In Figure 5 you can also follow the yearly changes with basis points.
Şişecam had produced 1,3 million tons of glass, 1,1 million tons of soda and 908 thousand tons of industrial raw material at this period.

2 – Income Statement
Covid-19, war in Ukraine, cost of living crisis and supply chain bottlenecks distorted demand and supply conditions in everywhere. In three years we have gone through very unusual events and uncertainties.
Mr. Görkem Elverici, CEO of Şişecam, commented on the earnings release exactly on this issue as following: “Amid hyperinflationary environment, which is still affecting the costs and in the meantime the demand dynamics on a global scale, Şişecam successfully managed this period with both its effective cost management approach and stock optimization-based management style.”

Highlights from the Income Statement
In Figure 6, I have attached another executive summary table. Here we see changes in revenues, cost of sales and gross profit compared to previous quarter and last year’s same quarter. There is a slight decrease in sales revenue but cost management makes itself apparent. This efficiency passes to the gross profit, and compared to previous quarter there is a 17% increase. With a 560 basis point rise in the margin, the gross profit margin completes the quarter at 34%. Although EBIT margin sinks drastically at this quarter, it is still satisfying at 17%.
Second part of the table consist of last twelve month figures and less noise is more useful in some analysis. And for those who prefer graphs instead of numbers, Figure 7 might be helpful.

At this point, it is apt to see where this 28.365 million TRY revenue comes from (as I explained in segments above) and what does left of it at the end of the quarter. In Figure 8, Sankey Diagram shows that when the cost of sales deducted from the revenue, we reach to gross profit and from there on Şişecam ends the quarter with 2.736 million TRY net income.

Income from investing activities decrease sharply, but indeed it was the previous quarter that was extra ordinary. We can trace back that to EBIT, too. In addition to that tax expenses affect the net income negatively. Finally, the company makes new investments (sand preparation facility with 490K tons/year production capacity in Tarsus; The Stockton Port investment, and cold repair of furnaces); made a 1,9 million EUR cash payment for Şişecam Çevre Sistemleri A.Ş. and become the sole shareholder, and donated 200 million TRY in cash for the earthquake that took place in Turkey, in February.
These all sound good for future, but might bring pressure for the short term, especially in such a volatile and recession expected global environment, excluding the economic and geopolitic conditions in Turkey.
In Figure 9, we can see the revenue growth and cost increases. Some part of those due to inflation and some part comes from the investments. Let’s hope the latter may bring better margins and profits in a disinflationary world.

3 – DCF Valuation
Discounted Cash Flows & Intrinsic Value
Before arriving to this point, I was following the merger narrative. Although 4 years is too short to make drastic decisions we have witnessed in this period very rare occasions that change the way we live in. Agile, flexible and quality oriented approach of Şişecam convinced the investors that merger was a crucial step in efficiency. There is a better cost management, global competitiveness and the company has a privileged status of having all the segments of glass production under a single roof. Therefore, I keep on my sustainable growth narrative based on investing and balanced growth, and run a full-fledge DCF Valuation for Şişecam at every quarter.
Below you can find the output of my recent valuation that reflects the 2023/Q1 results.
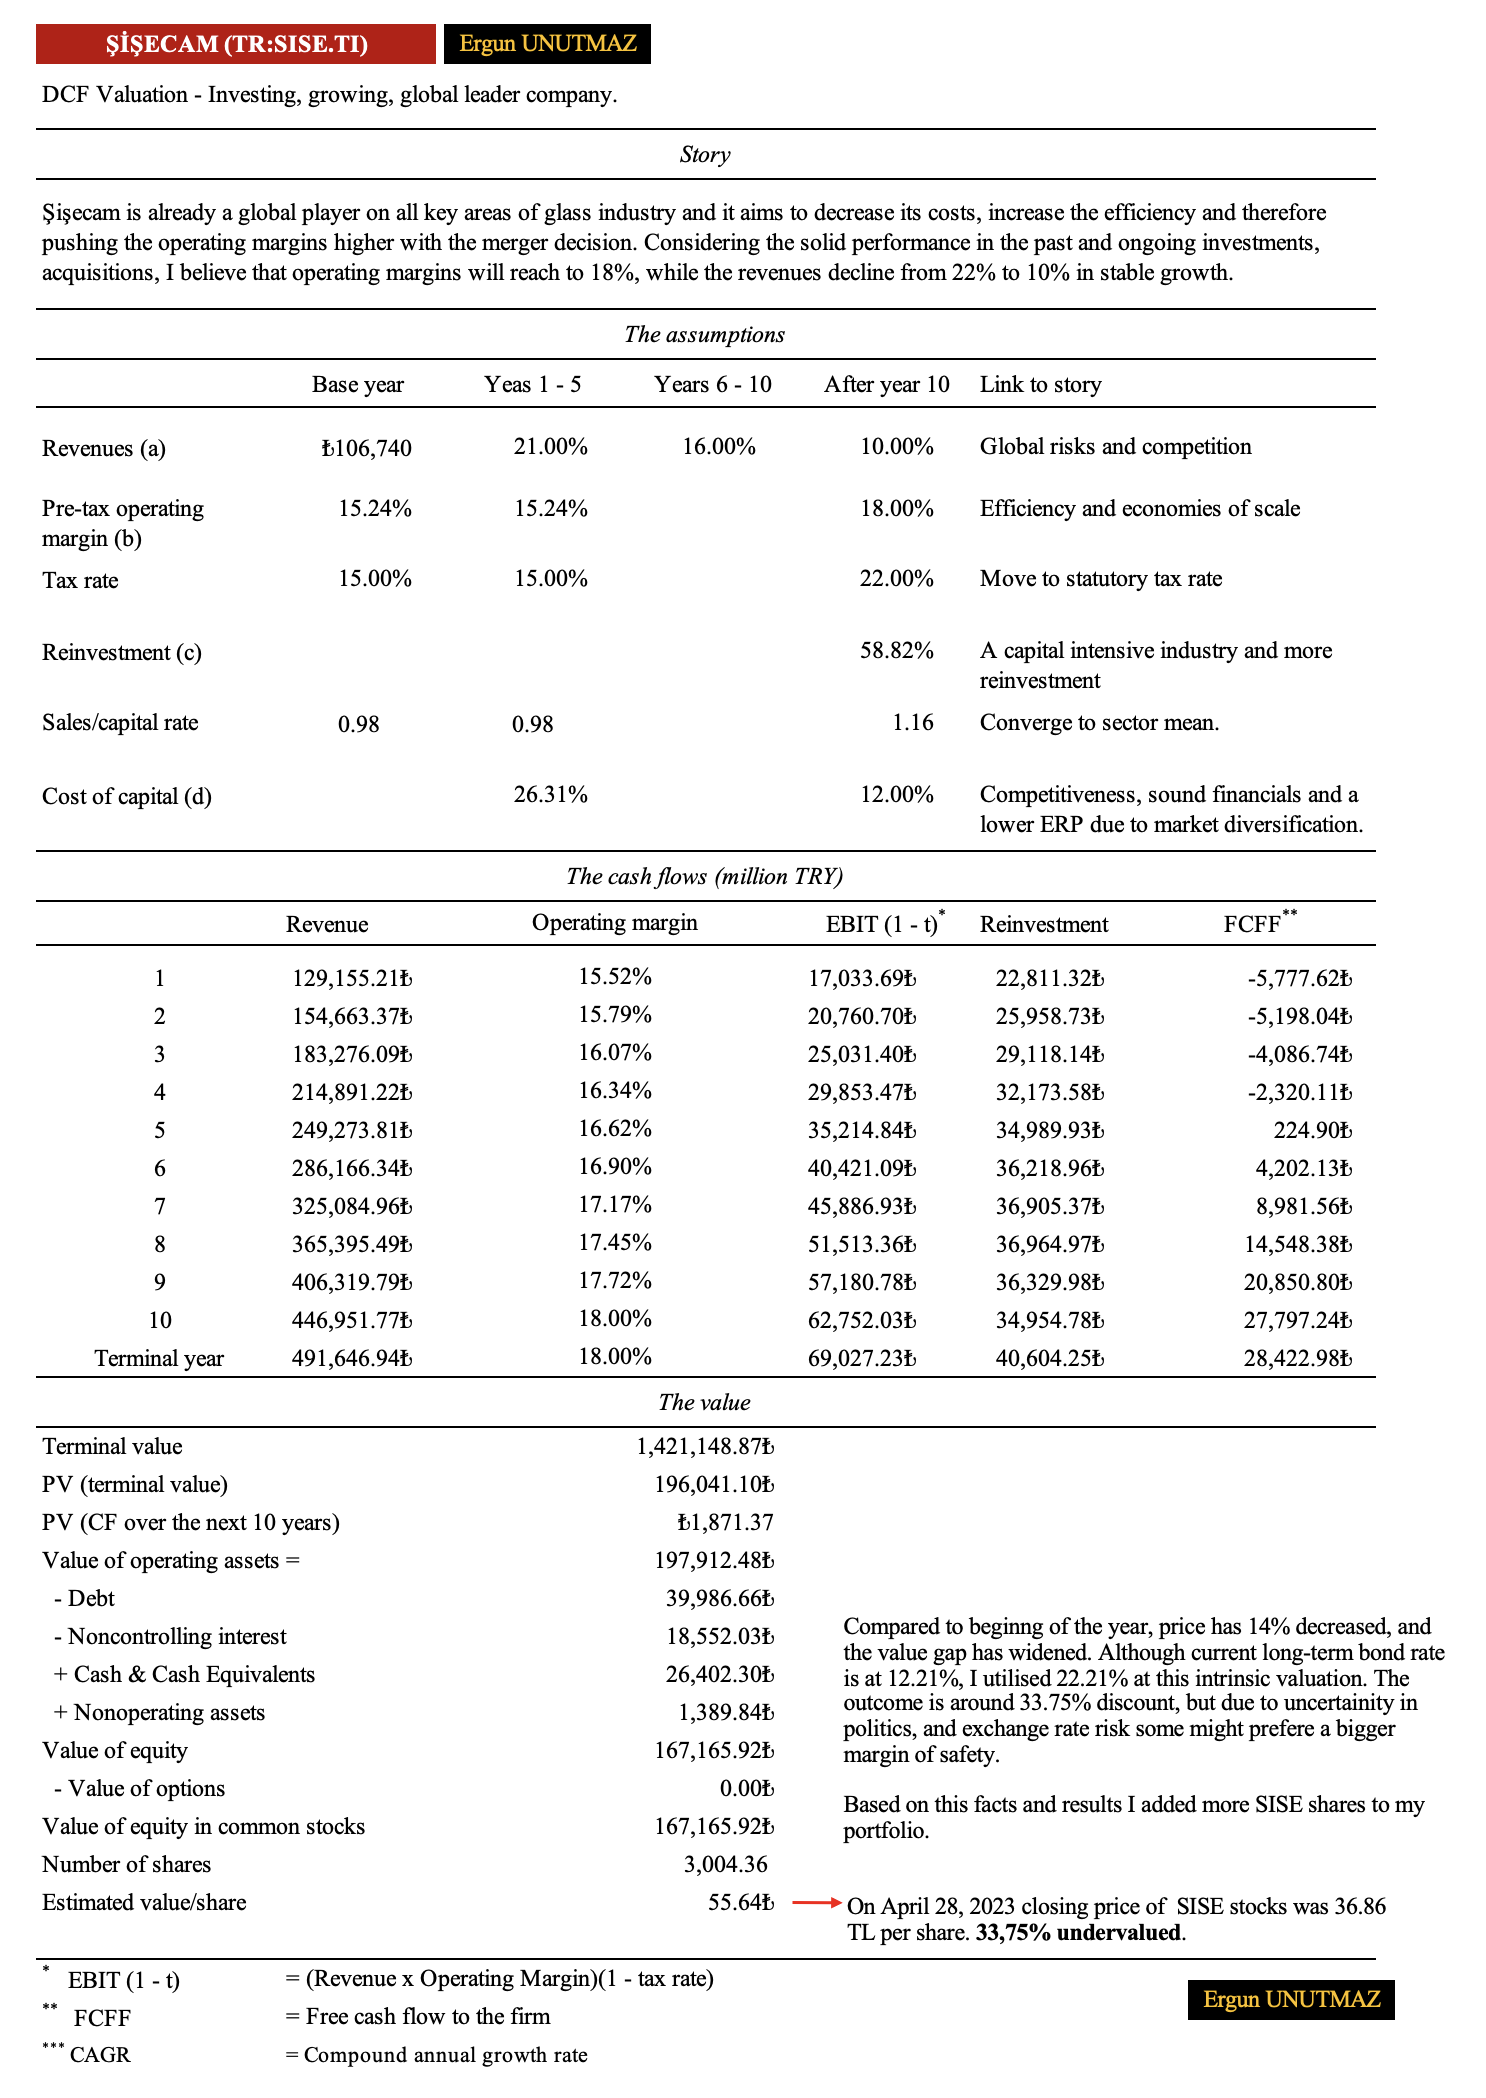
Discounted Cash Flows (DCF) Analysis
In this study, I started with the current revenue growth and decreased it from 21% to 10% in stable growth. When it comes to pre-tax operating margin I believe that it will increase 275 bp and reach to 18% at the tenth year. The other variables and shifts are given above. Although 10 year government bonds in Turkey indicated a 12,21% yield, I have added 10,00% risk premium to that and valued the company more conservatively.
On April 28, 2023 (last transaction day before the disclosure of the financial report) closing price for the SISE stocks was 36,86 TRY per share. The intrinsic value that I have calculated on May 01, 2023 was 55,64 TRY per share. According to my assumptions and expectations Şişecam stocks was 33,75% undervalued.
Therefore, I have made additional purchases to my long-term investment portfolio. But I’d like to remind that all calculations are prone to error and even if they are perfect, markets have their own dynamics and value-price gap may widen before it converges.
Şişecam is one of the companies that I evaluate in every quarter and have in my global portfolio for years. I hope this figures, analysis and calculations are also useful for you, too. For further documents and news please check Şişecam Investor Relations.
With this opportunity, I’d like to thank to Şişecam management and all employees for their efforts and performances, who are ready under all circumstances for the best of the company and to create sustainable value.
Ergun UNUTMAZ, 06.05.2023
You can read my previous works on similar subjects by clicking the links.
ŞİŞECAM Valuation 2022/q2
ŞİŞECAM Outlook 2022/q4
Şirket Analiz: Puma SE (PUM)
I wish you all the best.
Disclaimer
General information and statistics that are provided herein this article acquired from official sites and public resources. Thoughts and comments belong to the author and do not represent any other third parties’, public/private institutions’ or organisations’ point of view.
The information contained on this article is not an offer to buy or sell securities, foreign exchanges, indices or any other financial instruments. Works on this blog also comprise educational materials, translations, summaries and experience sharing essays. I do not provide any kind of financial services. For the investment advices and recommendations, please refer to registered institutions and authorised bodies. Parties, who gets information from this website, accept to bear the possible benefits and risks at their own responsibility, and act through their own initiative.
4 Comments
Çağrı
Ergun Bey merhabalar. Yatırım amaçlı gayrimenkuller faaliyet dışı varlık olarak değerleniyor mu? eğer bu şekilde değerleniyorsa, sermaye getirisi bölümünde nakit varlıkları çıkardığımız gibi yatırım amaçlı gayrimenkul değerini de düşmemiz gerekiyor mu? cevap verirseniz çok sevinirim.
Ergun UNUTMAZ
Merhaba, değerlemede daha sağlıklı sonuçlar için şirketin asli faaliyetlerine ve net faaliyet kârına odaklanmak gerekir. Doğal olarak şirket GYO, vb. değilse ve yatırım amacıyla gayrimenkullere kaynak ayırıyorsa bunları düzeltme işlemi sırasında ayrıca dikkate almak gerekir. Bu kalemlerden elde edilen değerler sonradan hesaplamaya eklenir.
Mustafa
Hocam merhaba,
Yapmış olduğunuz analiz ve finansal okuryazarlığa sağlamış olduğunuz katkılar için teşekkür ederim. Değer yatırımcısı olma yolunda yazmış olduğunuz blok yazılarınızı takip ediyorum. İNA analizi yönetimi öğrenmeye çalıyorum, yapmış olduğunuz bu analizde operating margin için aşağıda vermiş olduğunuz değerleri nasıl bulduğunuz bulamadım. Bu konuda yardımcı olur musunuz?
1- 15,52%
2- 15,76%
3- 16,07%
4- 16,34%
5- 16,62%
6- 16,90%
7- 17,17%
8- 16,45%
9- 16,72%
10- 18,00%
Ergun UNUTMAZ
Siz de sağ olun.
Burada iki aşamalı yöntem kullanılmış olup başlangıç değeri mevcut veri setinden elde edilen orandır. Onuncu yıl için kendi varsayımlarınıza göre kâr marjı için bir oran belirleyebilir, hatta altıncı yılda ikinci bir ara oran ile diğer dönemleri buna göre yakınsatabilirsiniz.