Şişecam 24/q3
Türkiye Şişe ve Cam Fabrikaları A.Ş. was founded in 1935 by İş Bank and currently consists of a holding company with 57 subsidiaries, 1 joint venture and 4 associates. Şişecam has also 2 joint activities.
Şişecam is among the world’s most prestigious manufacturers and with its 89 years of corporate history, it has a considerable experience and high degree of specialisation. As a global company Şişecam has production activities spanning 14 countries on 4 continents, and sales in more than 150 countries.
Following the merger, which was completed as of 01 October 2020, Şişecam was on track to become one of the top three global producers in all its core business lines. Although the value creation objective seems to be wounded, the company is still committed to its long-term objectives. Following the high inflation period, tight monetary policies, higher interest rates and rising costs; downturn in demand, dim macroeconomic outlook and low growth in China had a drastic impact on company’s financials. Retreating export values and difficulties in pricing power due to shrinking purchasing power finally brought the operating profitability to negative numbers at the recent income statement.
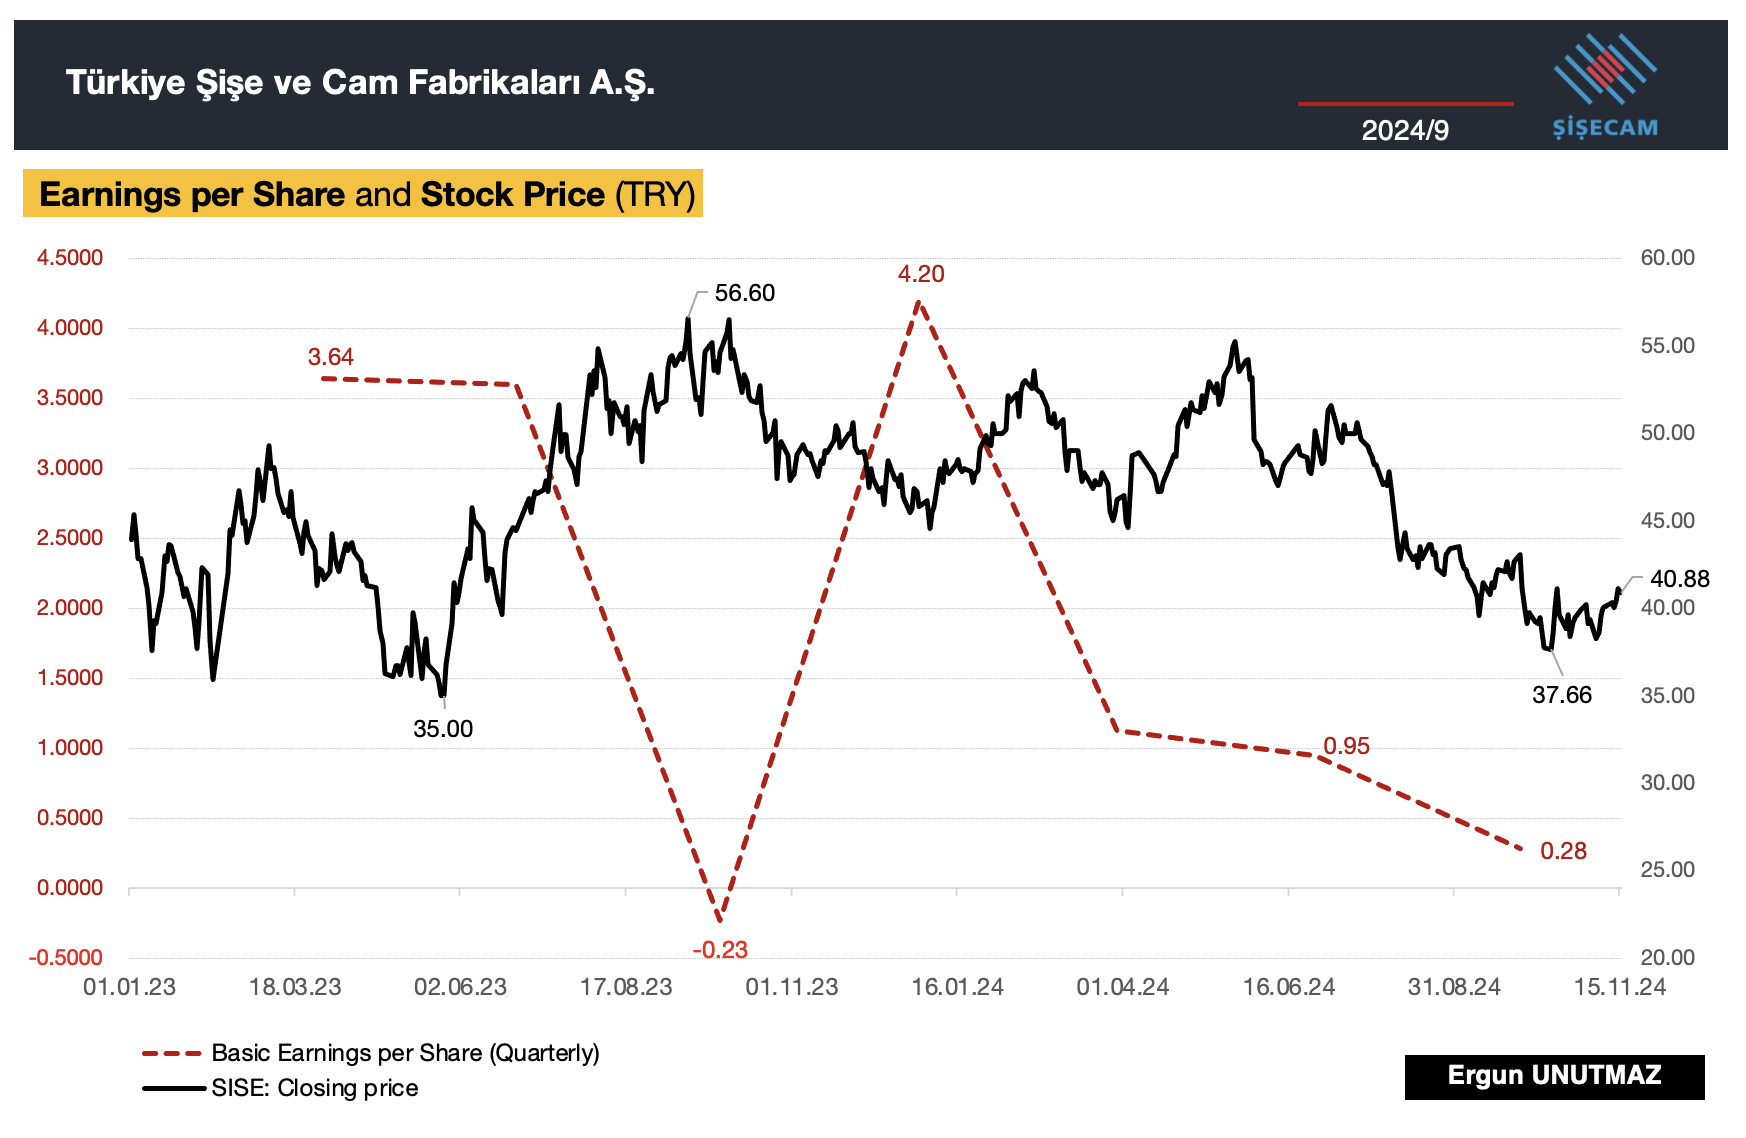
On October 7, I have published the Stock Analysis for Şişecam and showed how the stock underperformed and diverged from the BIST100 Index. Year to date decline in share price was around 30% and historical maximum drawdown is at 37% level, in the last five years. For those who would like the get the core of a long analysis, I have added a chart above. As the profitability melts down, share price in the market take a nose dive. If the economic outlook improves and company management achieves the high profit margins again, then the share price increases. So there is a justification in market sell off, but we need to have a closer look at the recent financials and try to get a better grasp to shape our portfolios.
After this brief introduction, now let me cover the third quarter financials of the company. But a quick reminder: Due to application of inflation accounting in accordance with TFRS, TAS 29 and the announcements made by the Public Oversight Accounting and Auditing Standards Authority, financial statements are adjusted since 2023/q4. Unfortunately, continuously changing figures and missing quarterly data for the periods which are not provided in the reports, make the LTM and DCF analysis vulnerable to forecast failures. With those reasons, I didn’t publish my 2024/q1 report and until the data settle, I will share only quarterly or year-end figures and comparisons, and my calculations based on given data.
Executive Summary and Key Financials
Previously Şişecam managed to exceed all expectations and produced solid results, but since mid last year key financials and share price do not look tempting. On the earnings release, Mr. M. Görkem Elverici, CEO of Şişecam, explained the factors and challenges that were causing the decline, and this comment from him gives a broader understanding: “The global economy’s tough conditions are impacting all institutions and sectors, including ours. We recognize the need to constantly monitor evolving global trends, update our strategies, and stay aligned with our long-term plans. By implementing effective investment and cost management policies, we manage risks proactively and prioritize optimization in every process.”
In the previous report, I have also mentioned the deep deterioration in half-year financial results and a negative figure for EBIT. It seems like the we are at a point that might constitute a bottom point. I do not expect a quick recovery or strong comeback, but those optimization efforts should reflect in the figures, which are at historical lows.
Consolidated net sales fell to 136.3 billion TRY (USD 4.0 billion) in 2024/q3 from 159.0 billion TRY (USD 4.6 billion) in YoY terms. Quarterly change is minus 6% from 45,526 million TRY in 2024/q2 to 42,867 million TRY in 2024/q3. At the end of first nine months of 2024, capital expenditures amounted to 18.6 billion TRY. Şişecam has produced 4.2 million tons of glass, 3.5 million tons of soda ash, and 2.8 million tons of industrial raw materials.
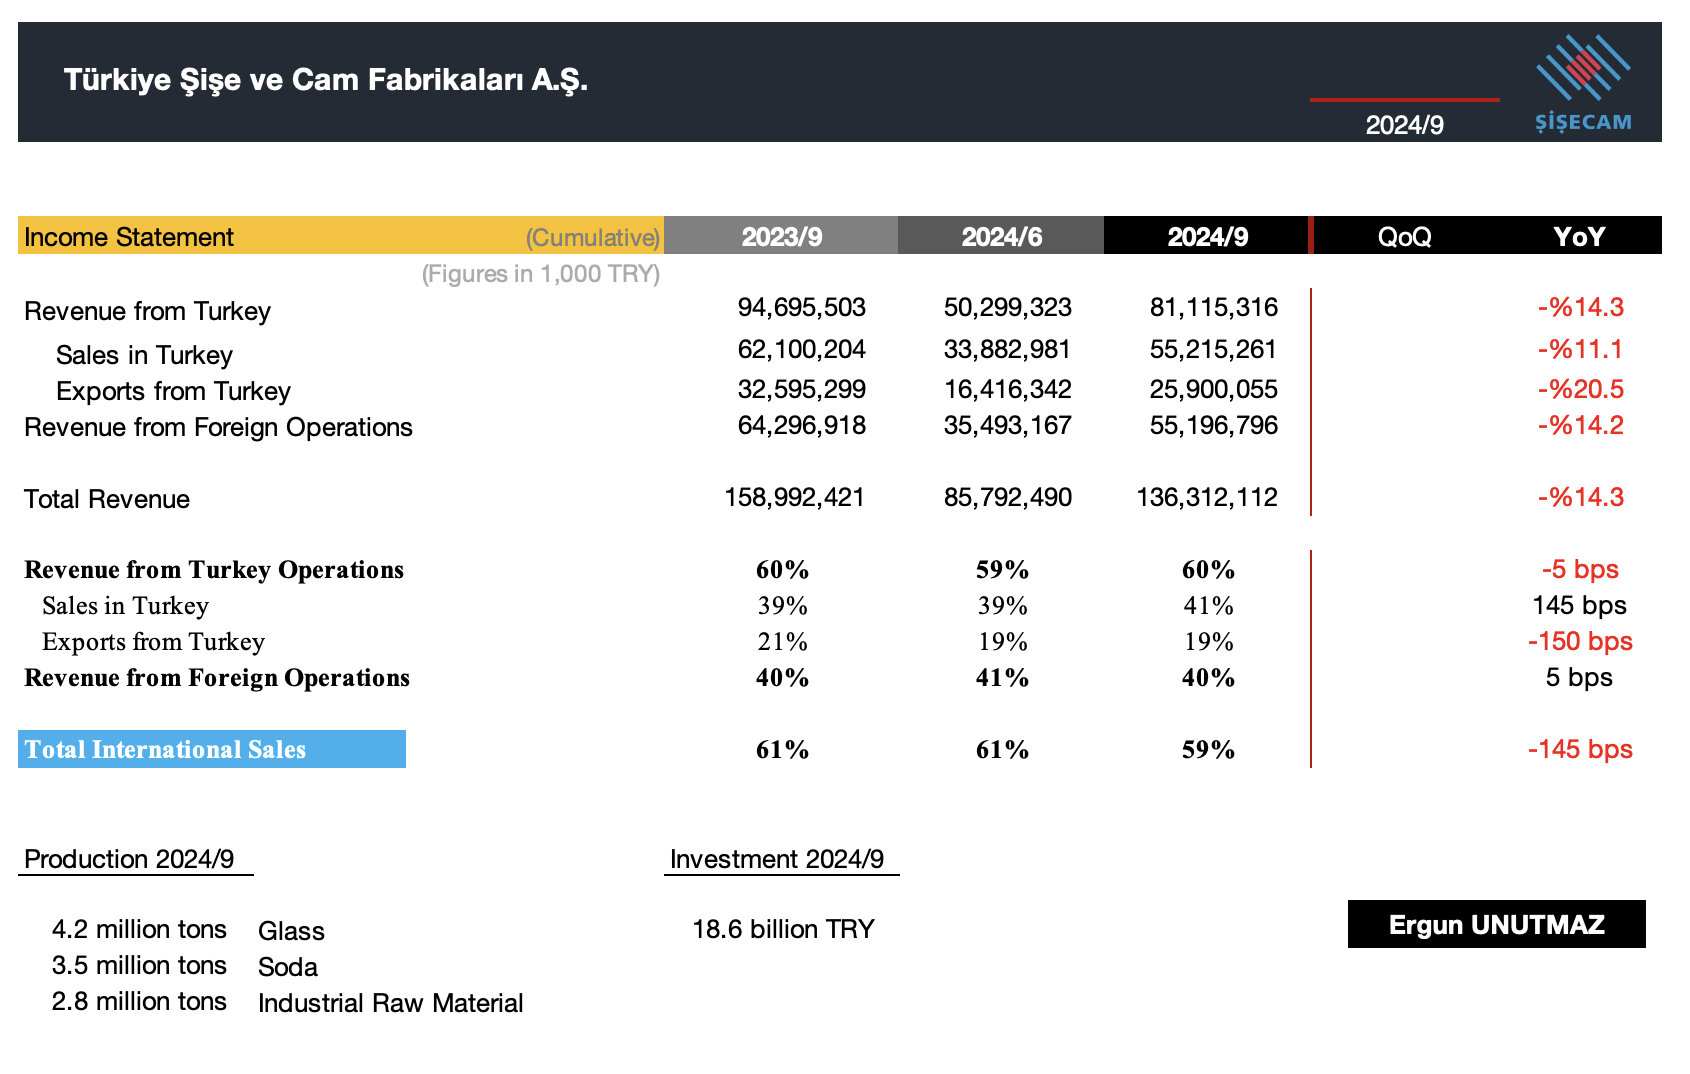
International sales accounted for 59% of total sales, and Share of international revenues is at 59% in the 2024/q3, while the sales in Türkiye is at 41% and exports from Türkiye is at 19%. These figures are slightly below the historical data, but still in line with previous trend.
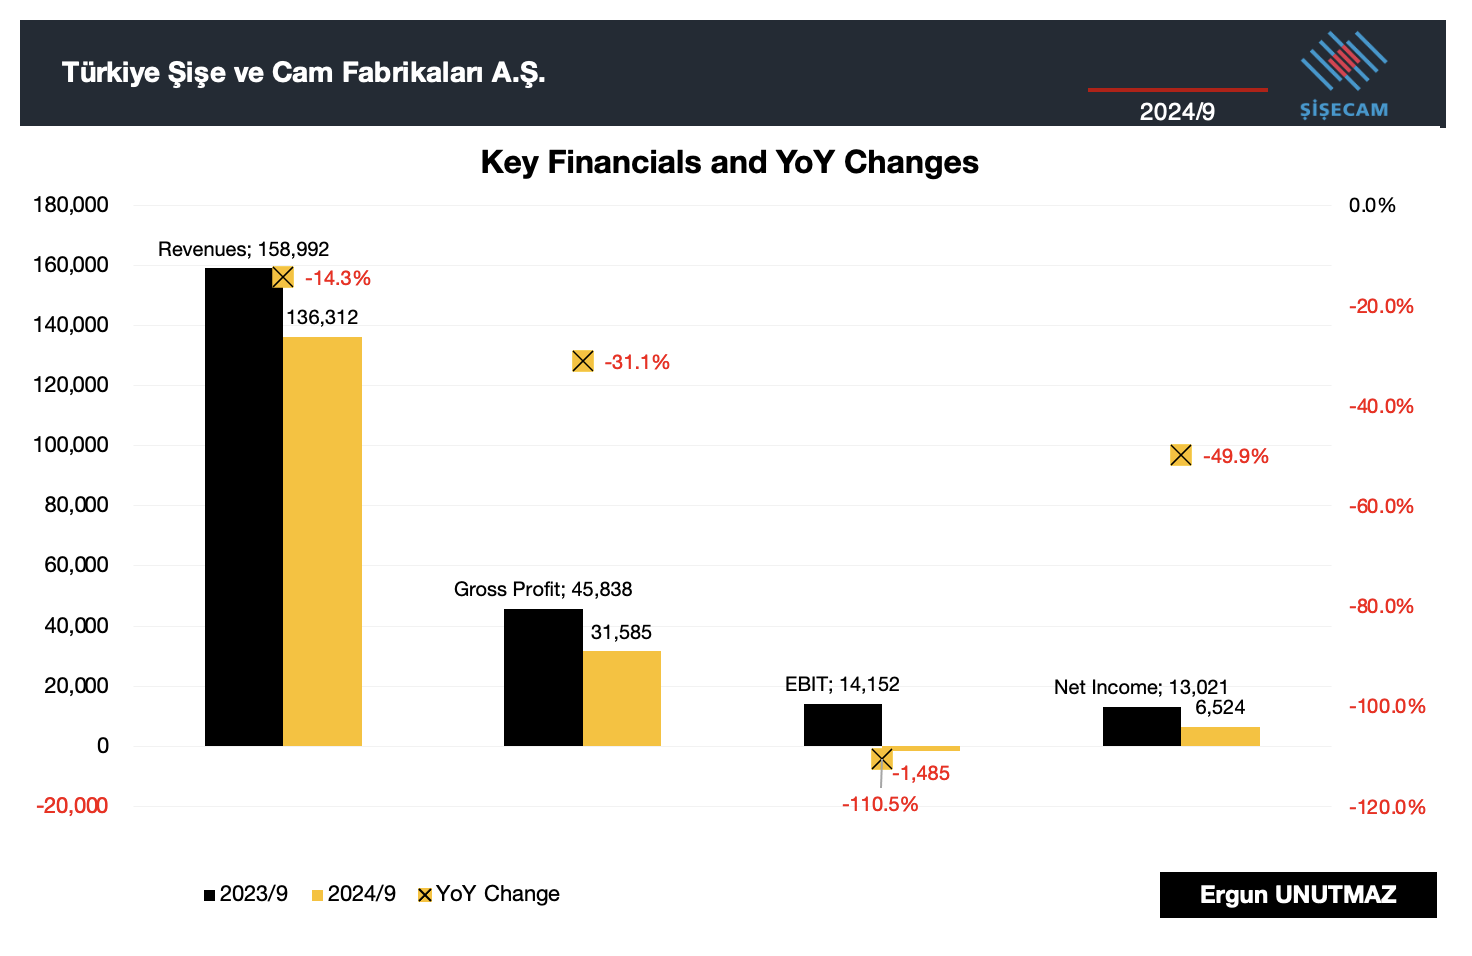
At the end of third quarter and with cumulative figures, compared the same period of previous year: Consolidated revenue is down by 14.3% and this retreat is visible at all items with varying degrees. Gross Profit is down by 31.1%, from 45,838 million TRY to 31,585 million TRY. I follow the financials of the company since 2011/q1 and this is the second time that I record a negative EBIT for Şişecam. EBIT has declined from 14,152 million TRY to minus 1,485 million TRY. Decrease in 110.5% from 2023/q3 to 2024/q3. Finally, Net Income is also down by 49.9%, from 13,021 million TRY to 6,524 million TRY.
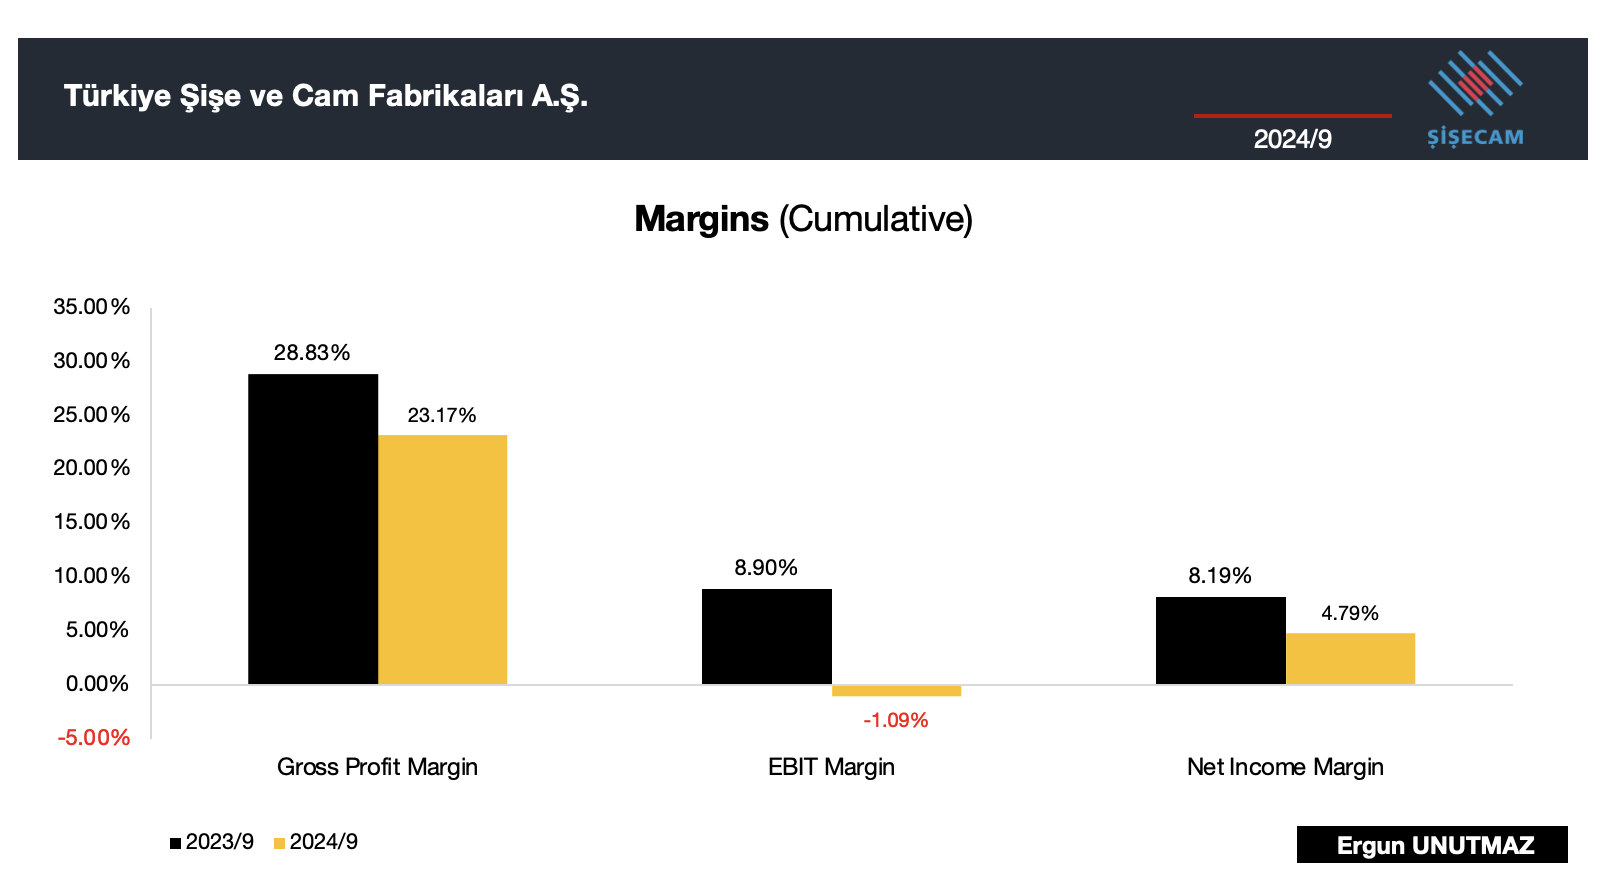
When it comes to margins, I have plotted below the changes for three key financials. Gross profit margin declined from 28.83% to 23.17%. The change is minus 566 basis points (bp). EBIT margin collapsed from 8.90% to minus 1.09% with a 999 bp decline. As a last item, net income margin is also in decline. In year on year terms, decline is 458 bp from 8.19% to 4.79%.
Şişecam | Segments and Regions
Following the same methodology for Key Financials, you can see the Segmental Breakdown of Revenues from 2023/q3 to 2024/q3 in cumulative values. All seven segments record declines in 2024/q3 in a range from -5.9% to -27.9%. It was a very tough nine months. The columns represent values in million TRY and marks point out the YoY changes in percentage.
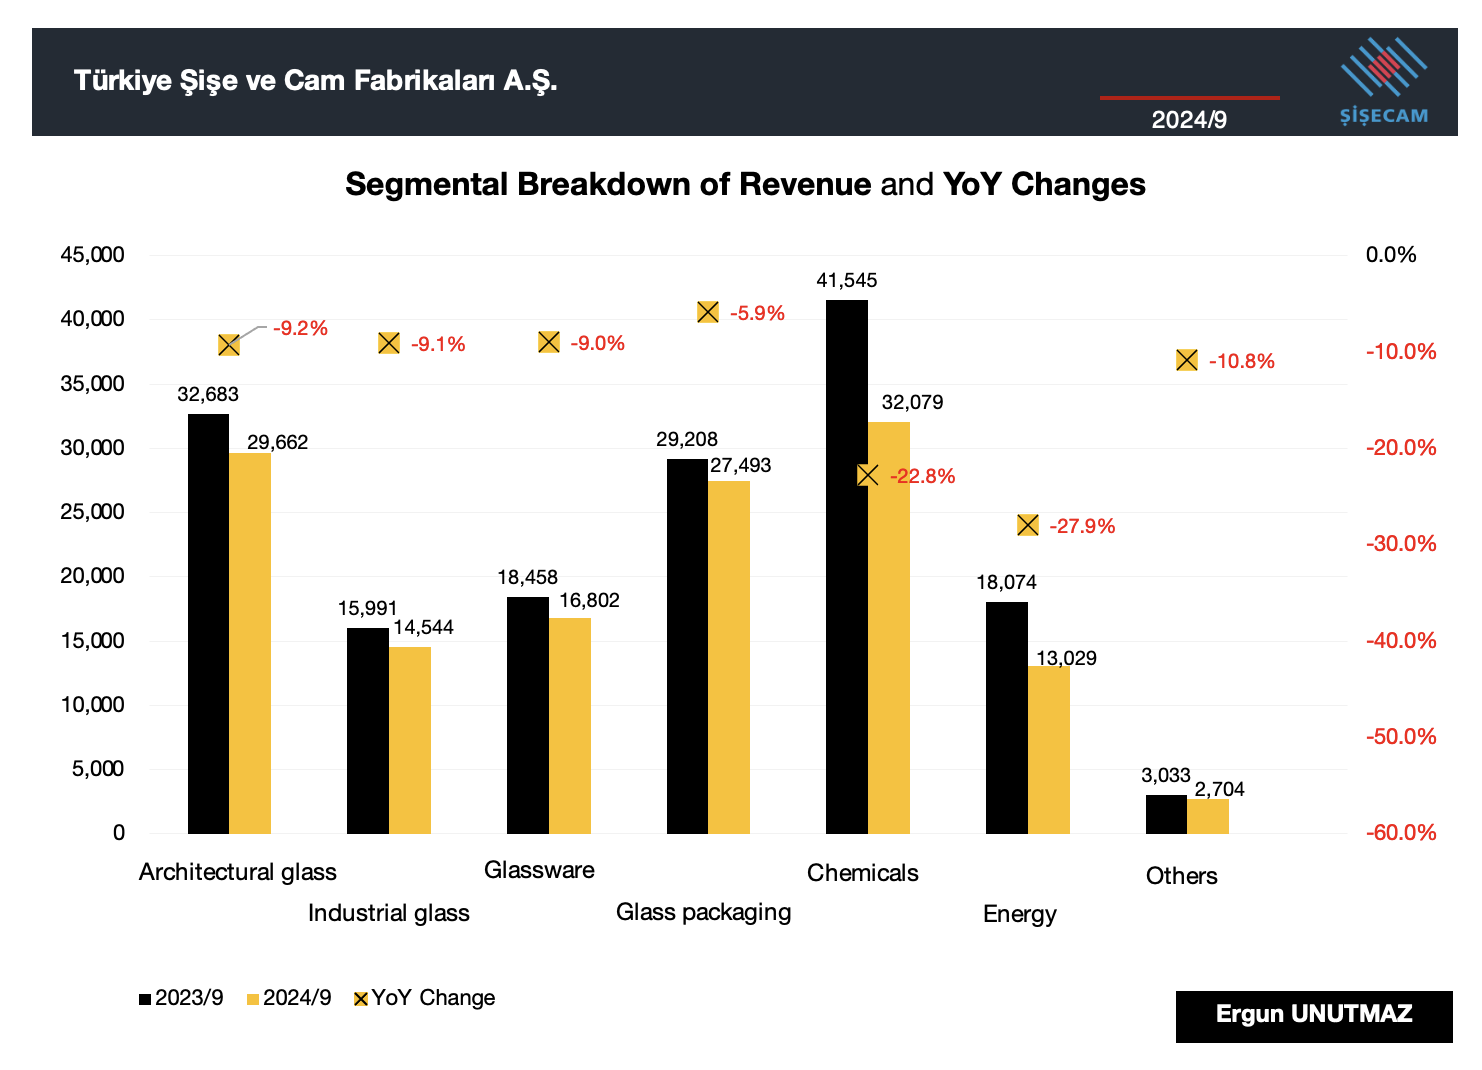
Architectural Glass was 2% up by volume, but pricing was -7%. Decrease is minus 9.2% from 32,683 million TRY to 29,662 million TRY. A similar trend is also visible in Industrial glass and Glassware with respectively 9.1% and 9.0% declines. Glass packaging had the minimum decrease with a 5.9%. Volume increase for this segment by 11%, and pricing effect was only minus 1%. Chemicals is a major segment and decrease here was 22.8% from 41,545 million TRY to 32,079 million TRY. A word also on Energy segment, 34% volume decrease and 7% pricing power loss was due to market conditions, product mix and currency.
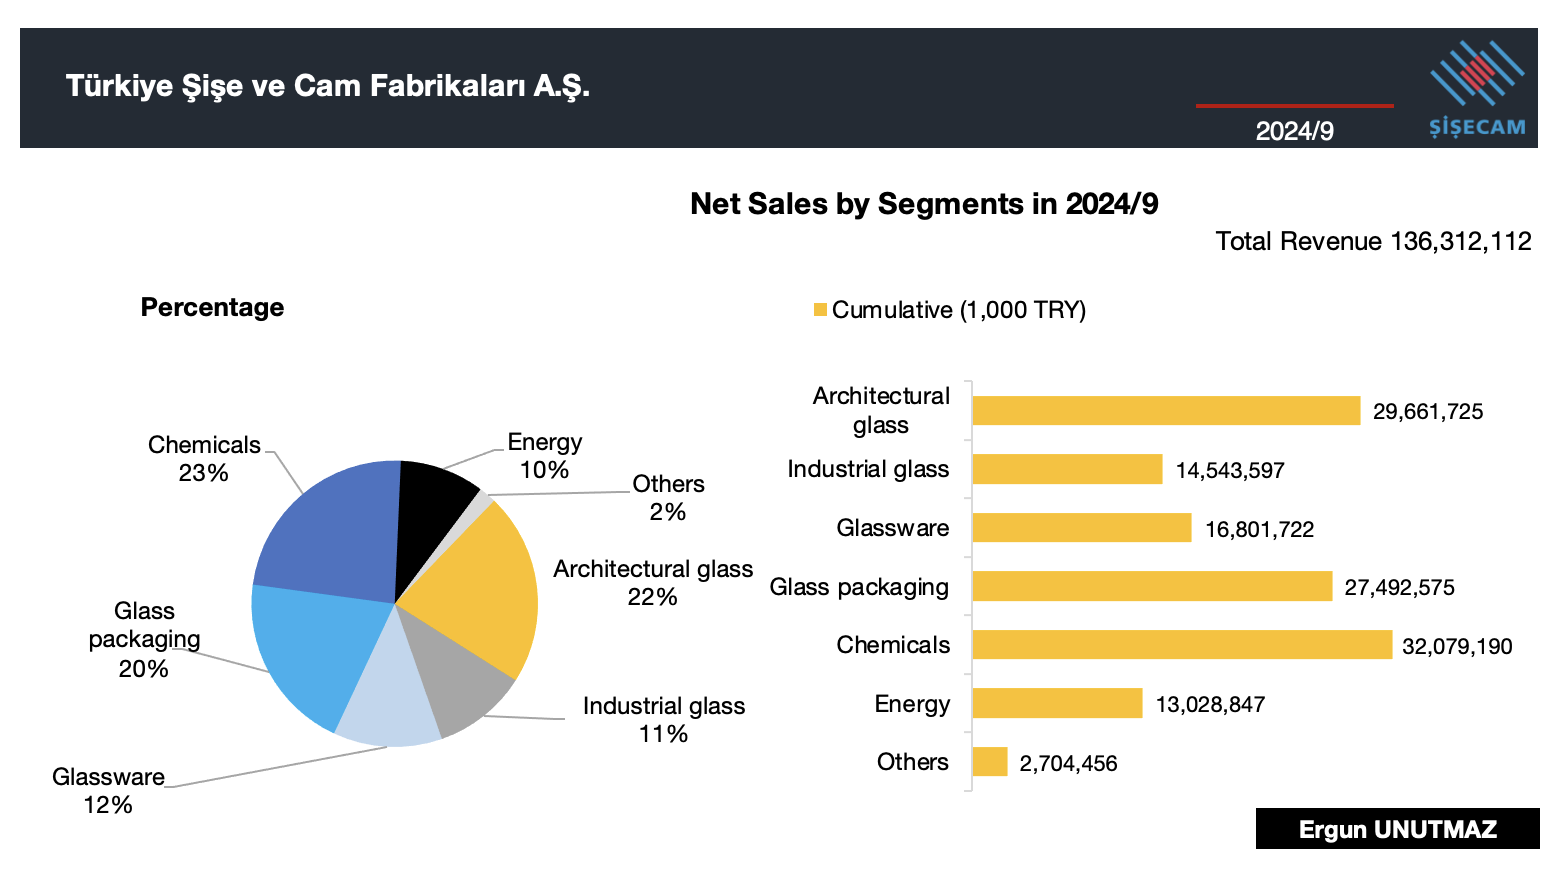
Above chart shows the net sales by segments in 2024/q3 in cumulative values. Chemicals is leading with 32,079 million TRY and this is 23% of sales total of 136,312 million TRY. Architectural glass is at the second place as usual and figures are 29,662 million TRY and 22%. You can check the composition from the pie chart on the left.
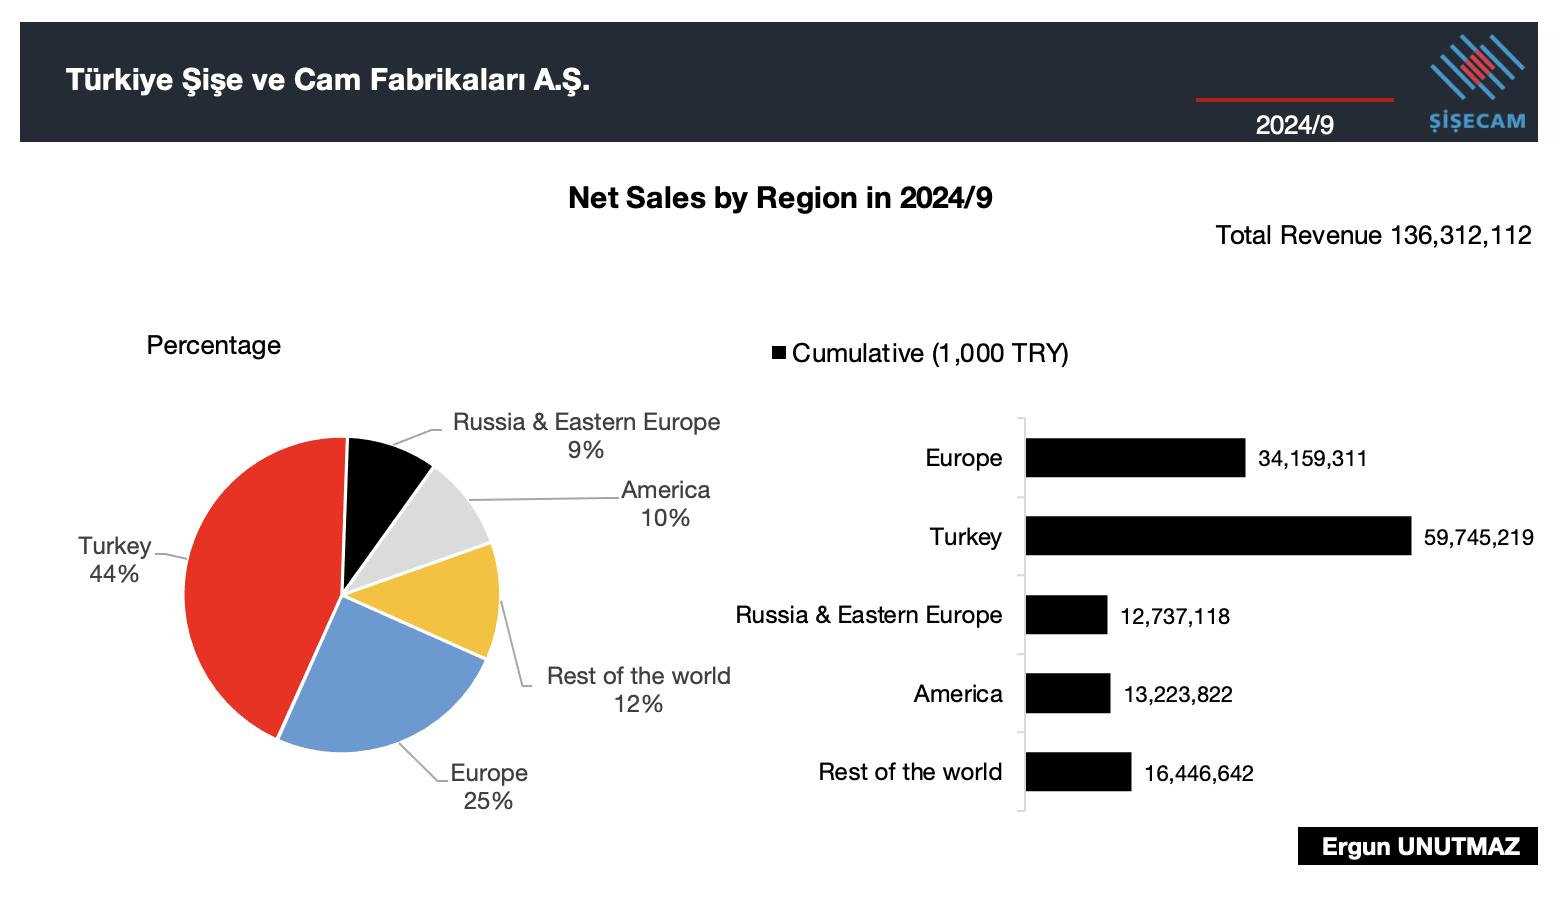
If we look at the regional breakdown of the net sales in 2024/q3 in cumulative values, we see that Türkiye is leading with 44% of all total. The corresponding value is 59,745 million TRY Europe is following it with 34,159 million TRY and the share is 25%.
Breakdown of Income Statement
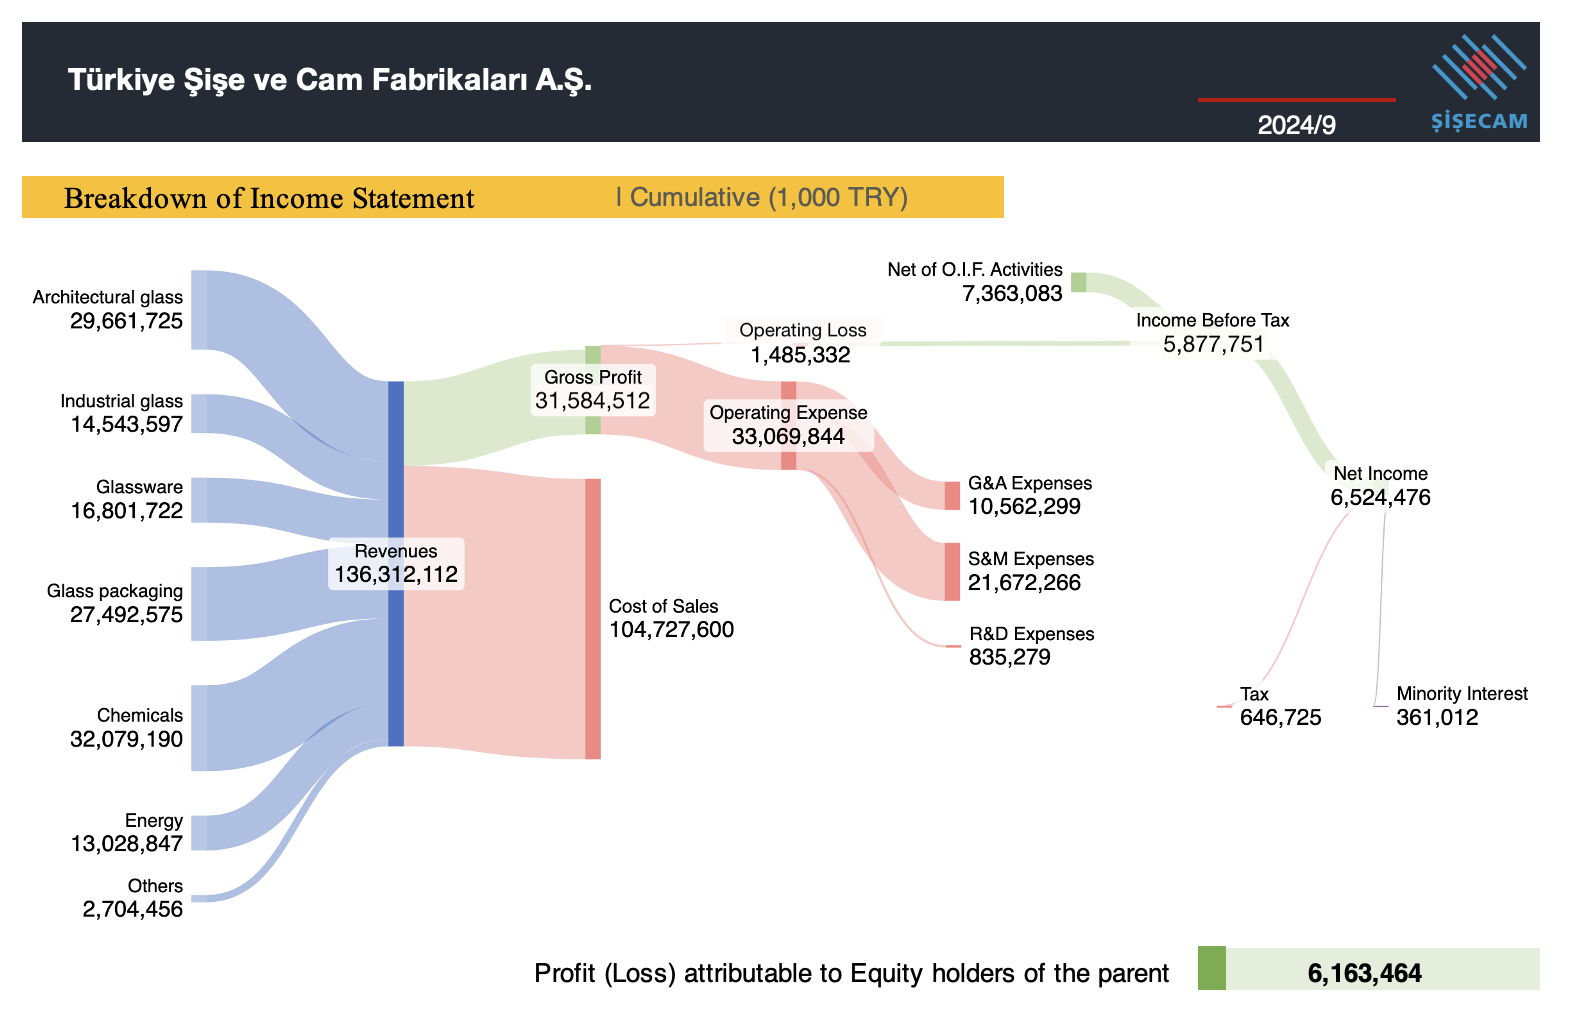
At this point, it is apt to see where this 136,312 million TRY Revenue comes from, and how it evolves to Net Income. In the following Sankey Diagram, I have plotted the revenues by segments on the left hand side. Then, I have deducted 104,728 million TRY Cost of Sales and obtained 31,585 million TRY Gross Profit.
Operating Expenses stood at 33,070 million TRY and sales, marketing expenses are dragging the profits with 21,672 million TRY. On the other hand, operating income left its place in previous report to operating loss and at this quarter it has continued to slide. Operating Loss in 2024/q3 is minus 1,485 million TRY and after adjusting for other items, Şişecam ended the third quarter of the year 2024 with 5,878 million TRY Income Before Tax figure. As the 647 million TRY Tax Income added to that sum, Net Income for the period became 6,524 million TRY, which is roughly 190 million USD. Profit attributable to equity holders of the parent is 6,163 million TRY.
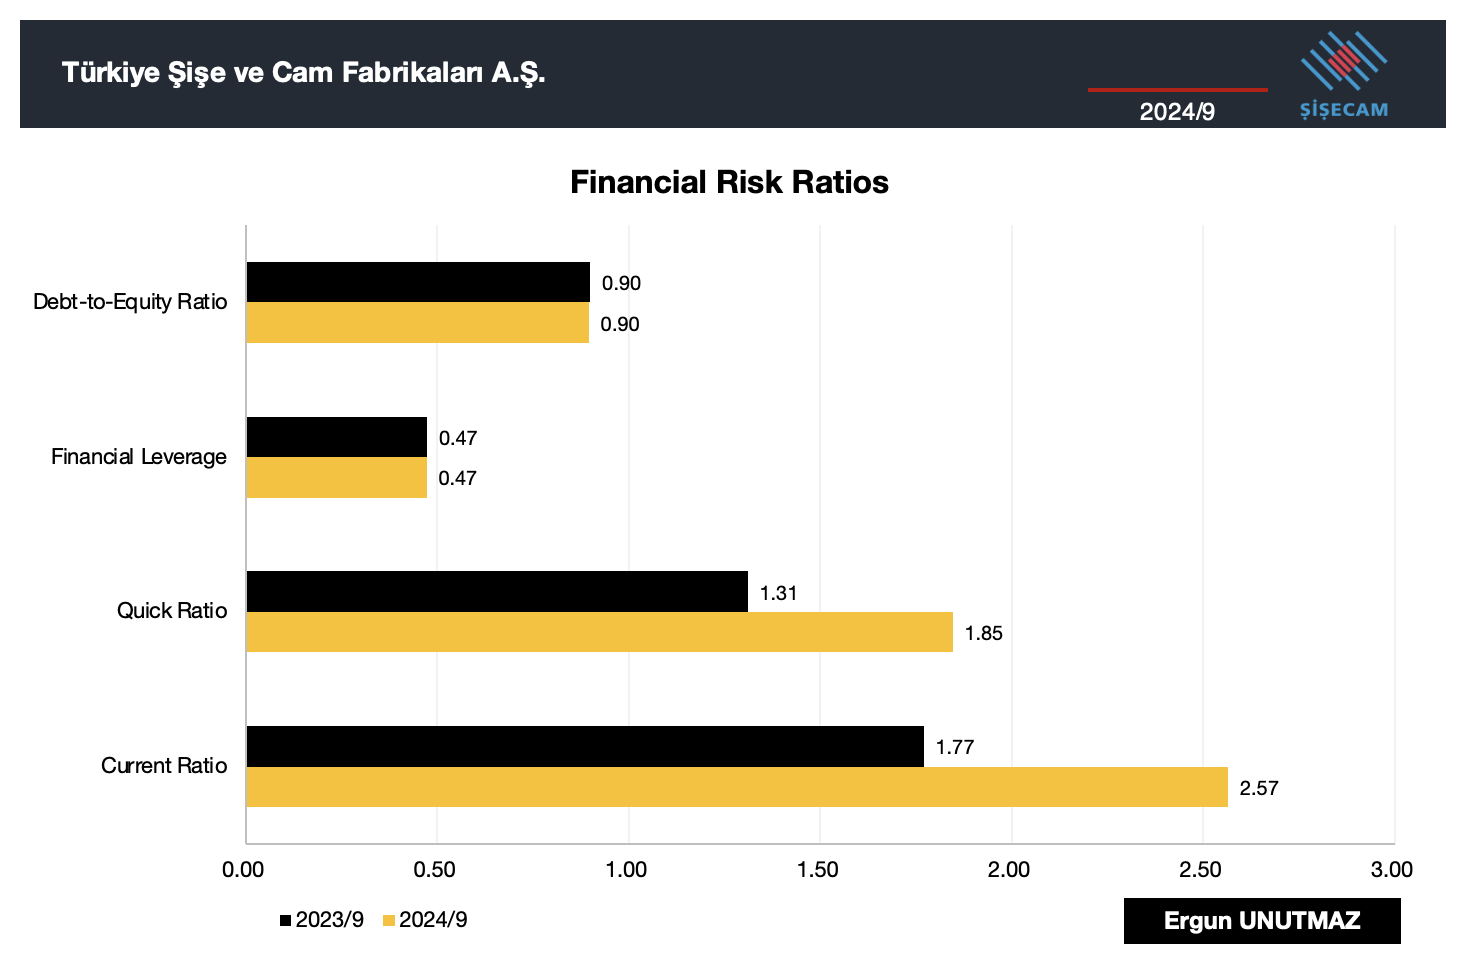
Şişecam | Financial Risk Ratios
Financial risk ratios for Şişecam look healthy and improving. Both the Financial Leverage that the company uses and the Debt-to-Equity ratios are stable at 47% and 0.90 respectively. When it comes to liquidity ratios Current Ratio is way up from 1.77 in 2023/q3 to 2.57 at the end of 2024/q3. Quick Ratio has also improved from 1.31 to 1.85.
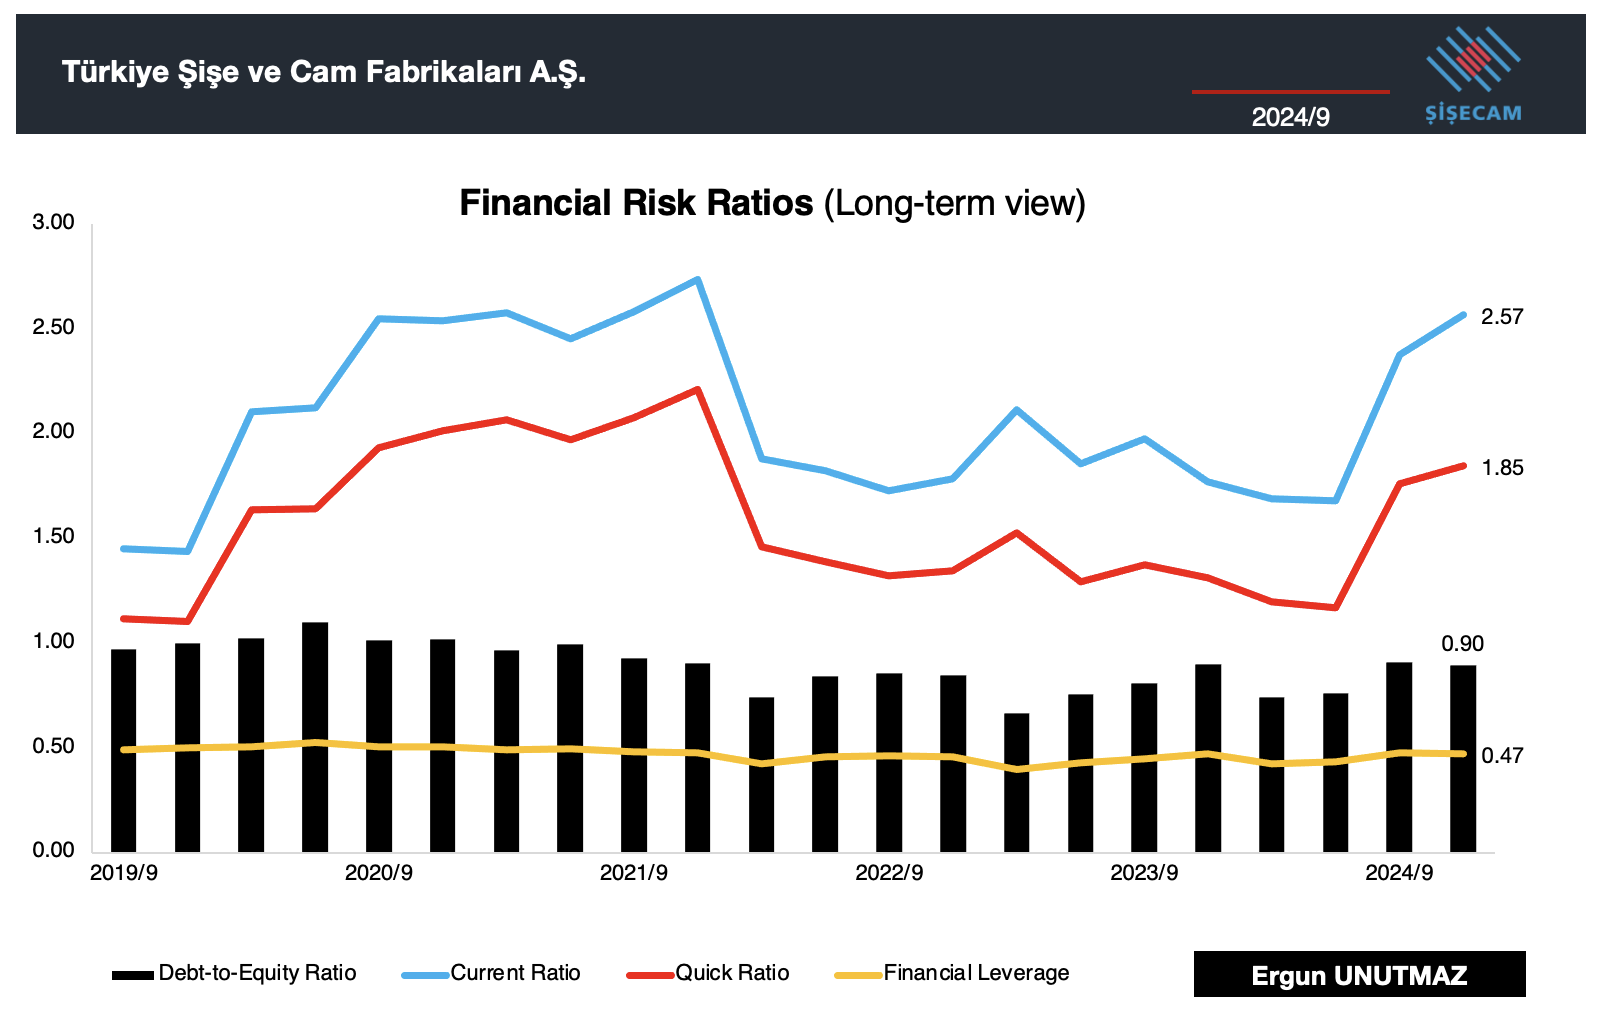
Below you can also find the long-term view for Financial Risk Ratios of Şişecam. Due to record setting Eurobond issue there was a slight jump on debt ratios, but all in all the outlook is stable and safe. Even short-term liquidity is above normal standards but I’d rather have such a balance in risky times that we are going through.
Şişecam | Share Buyback and Dividends
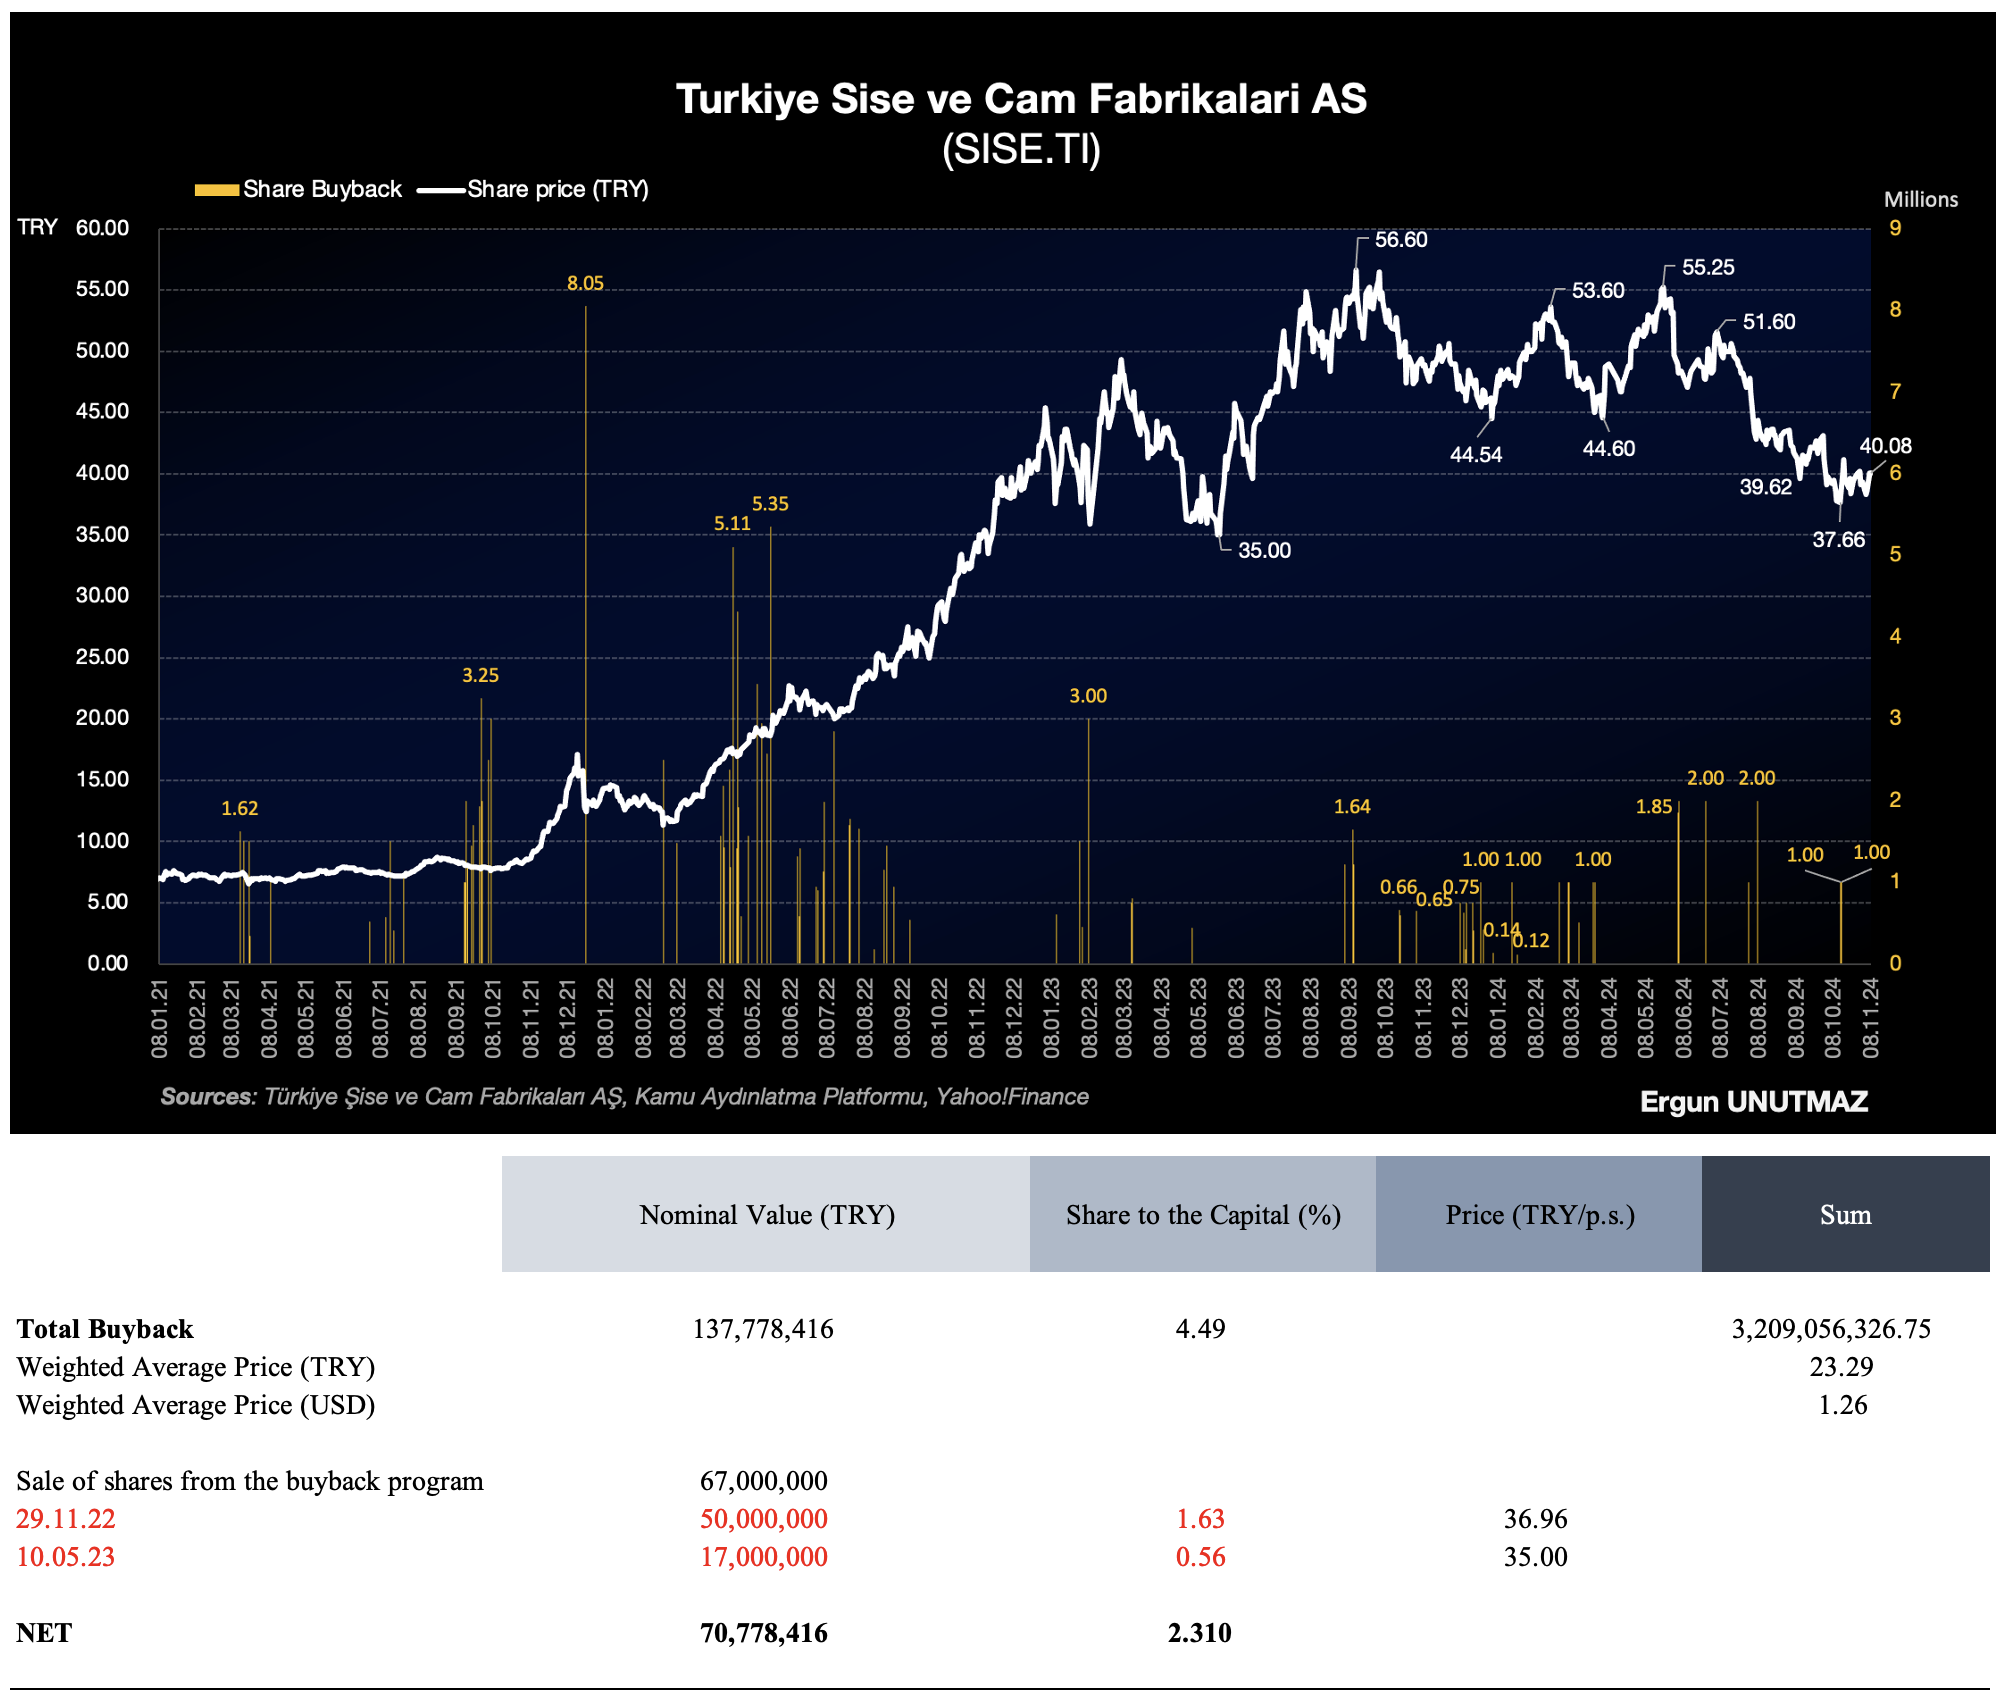
Şişecam has previously announced a buyback program on 26.02.2021 and made its first purchase on 15.03.2021. After reaching the first criteria Şişecam announced a second, supportive program and it is still ongoing. For further details you can read my article on Şişecam Stock Buyback.
In the chart below you can see share prices (daily closing) in white color, and buybacks in yellow (in Turkish lira). The most recent share buybacks were on October 14 and 15 with a 1.000.000 shares each. And the net total from the beginning of the program reached to 70,778,416 with a share of 2.31 percent to the capital.
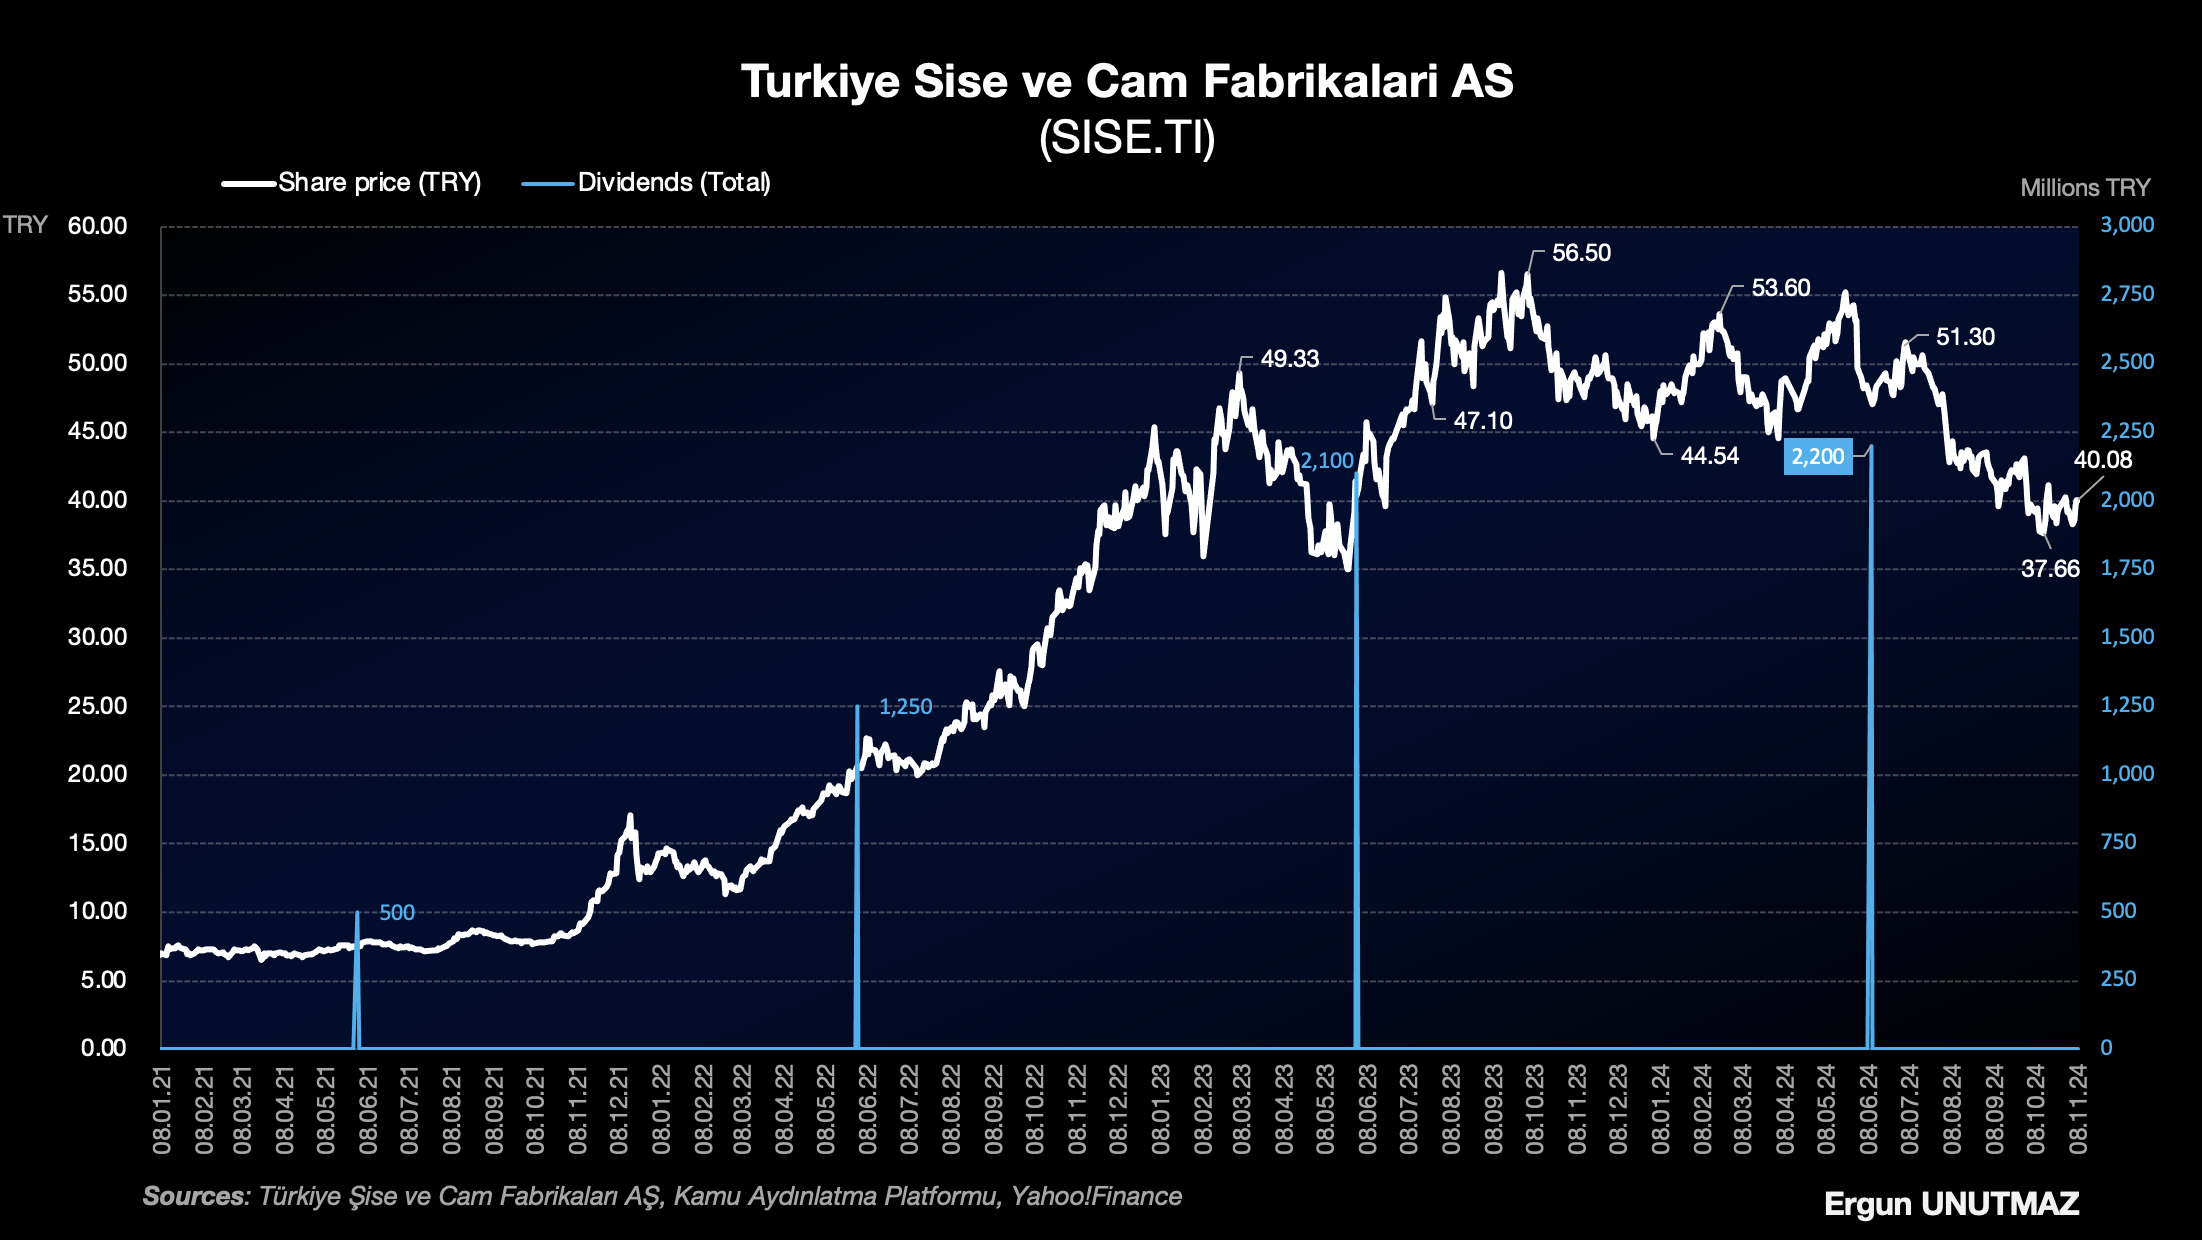
As we all know share buybacks are important for share holder value, but it is not the only instrument to that end. In addition to search for the best returns to the invested capital, Şişecam also pays dividends regularly with an increasing ratio each and every year. In 2024, with a precautious cash management, the company distributed 2,200 million TRY as dividends, which is 0.7182 TRY gross and 0.6464 TRY net per share.
Şişecam is one of the companies that I follow closely and have in my global portfolio for years. Considering all the developments that I tried to summarise above, share price has decreased from all time high levels drastically. Based on this losses and divergence in return performance compared to BIST100 Index, investors are not happy. Considering the time value of money there are also other burdens for investors, too. Looking at the financials there is a justification of this retreat up to a point, but Şişecam is a company with privileges. As Görkem Bey emphasised, there is a strong need for cost management and optimisation in every process. With the recovery in EBIT and profitability, share price will reflect positive improvements. Although I do not expect a fast and strong growth in markets, I believe that Şişecam will do all it can to reach its long-term goals.
I hope this figures, analysis and calculations are also useful for you, too. For further documents and news please check Şişecam Investor Relations use their official figures to avoid unintended errors or miscalculations.
With this opportunity, I’d like to thank to Şişecam management and all employees for their efforts and performances, who work for the best of the company and to create sustainable value.
Ergun UNUTMAZ, 11.11.2024
You can check my previous works by clicking the links.
ŞİŞECAM 2024/q2
Stock Analysis SISE
DCF Valuation Porsche AG
I wish you all the best.
Disclaimer
General information and statistics that are provided herein this article acquired from official sites and public resources. Thoughts and comments belong to the author and do not represent any other third parties’, public/private institutions’ or organisations’ point of view.
The information contained on this article is not an offer to buy or sell securities, foreign exchanges, indices or any other financial instruments. Works on this blog also comprise educational materials, translations, summaries and experience sharing essays. I do not provide any kind of financial services. For the investment advices and recommendations, please refer to registered institutions and authorised bodies. Parties, who gets information from this website, accept to bear the possible benefits and risks at their own responsibility, and act through their own initiative.